Quarry Drilling Penetration Rate: Why Brochure Numbers Never Survive the Bench
The rig's brochure says forty-five metres an hour. Your first week on the bench averaged eleven. Neither number is a lie — the difference is that one was measured in soft, dry, perfectly-fed limestone, and the other is the actual rock under your site. This article explains the gap between a brochure penetration rate and a forecast you can hold a schedule to, and where the error creeps in.
The Forecast That Died in the First Week
A quarry tendered a bench drilling contract on the assumption of 350 metres per rig per day. The number came from the machine's published penetration rate, applied to a ten-hour shift with a modest utilisation allowance. It looked conservative on paper.
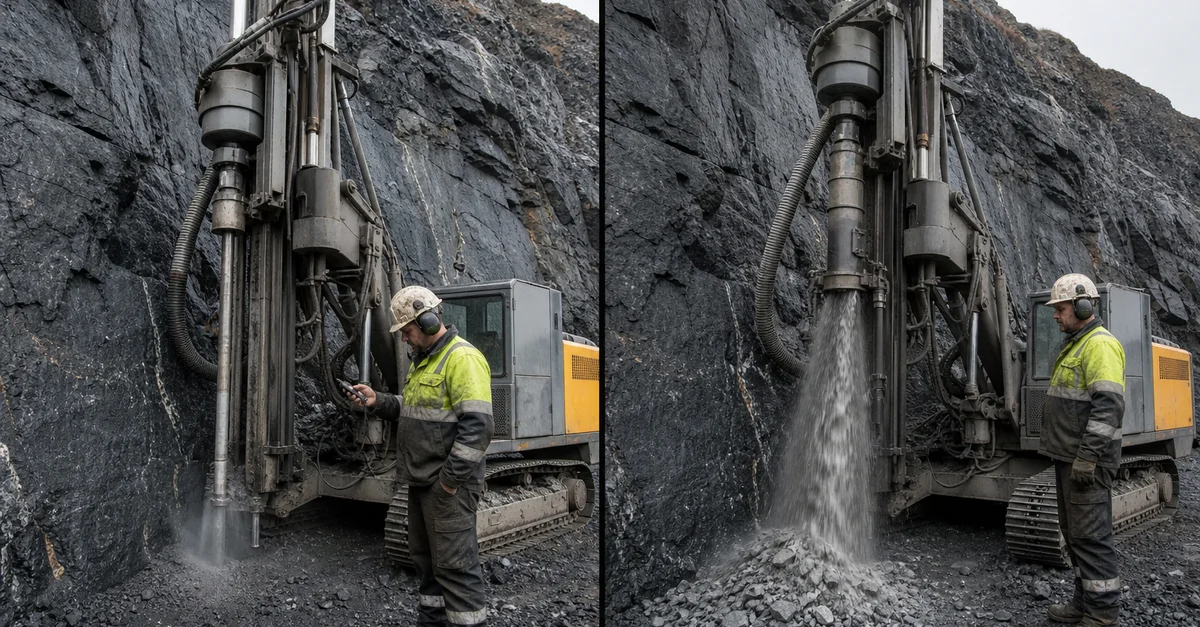
The first week returned 190 metres a day. The site blamed the rig. The real causes were three, and none of them was a fault in the machine. The pit had crossed into a zone of abrasive quartzite with a compressive strength roughly double the limestone the forecast assumed. The compressor was derated by altitude and by a dirty aftercooler, so the hammer was not receiving the air the brochure assumed. And bit life collapsed to sixty metres, which meant the crew spent a third of every shift on the ground changing bits rather than drilling.
The rig was fine. The forecast was built on a rate that had never existed on that bench. This is the most common scheduling error in quarry drilling, and it is almost invisible at the planning stage because every individual input looks reasonable.
What a Brochure Rate Actually Measures
A manufacturer's penetration rate is a real number measured under controlled conditions — but those conditions are chosen to demonstrate the machine, not to predict your site. Typically they assume a clean, competent rock in the softer half of the machine's range, a brand-new bit, full rated air pressure at sea level, a short hole where the string is light, and a skilled operator who is not on a production clock.
None of those assumptions is a deception. All of them are favourable. Taken together, they describe the best hour the rig will ever have, not the hour it will have at 3 p.m. on a Tuesday in a tough zone. The correct way to use a brochure rate is as a ceiling to test against, not as a planning input.
The Five Variables the Bench Adds
The gap between brochure and bench is made of five corrections, and each one acts independently to pull the real number down.
1. Rock drillability. The single biggest correction. Compressive strength sets the force required to break the rock, and quartz content sets how fast the bit dulls doing it. A formation that is both strong and abrasive hits the rate twice — it slows penetration and it shortens bit life at the same time. This is the variable the quarry almost never measures, and it is the one that usually kills the forecast.
2. Air delivered at the hammer. In DTH drilling, the air does two jobs — it drives the piston and it clears the cuttings. If the compressor is derated by altitude, heat, or a choked filter, the hammer strikes softer and the cuttings stall in the hole, forcing the bit to regrind its own rock. The math that connects hole diameter to the required air volume is in our guide to bit and compressor matching — a ten percent shortfall in air rarely shows up as a fault light, but it shows up directly in metres per shift.
3. Bit condition. A drill bit does not fail suddenly; it degrades continuously from the first metre. A button worn to a flat face spreads the hammer's energy over a wider area and penetration falls off a curve, not a cliff. The operator who runs a bit one shift too long is trading a cheap regrind for an expensive slow shift, and the speed loss is exactly the kind of erosion a schedule does not absorb. The wear signatures and the regrind interval are in our consumables guide.
4. Depth and string dynamics. Penetration rate is not constant down the hole. As depth builds, the drill string gets heavier, the pressure drop along the pipe grows, and the air has to lift cuttings further. A rate that holds at twenty metres will not hold at forty. Deep bench holes, or an operation that drills long rows without lifting, will average below the first-hole rate.
5. Operator parameters. Feed pressure and rotation speed have to sit in a narrow window for the rock at the bit face. Too little feed and the bit bounces, shattering carbide. Too much rotation and the buttons drag and heat-check. A tired operator on hour nine of a shift, or one who was trained on a different rock, drifts out of that window and the rate drifts with it.
Drillability: The Number the Quarry Never Measures
Quarries will weigh every tonne that leaves the gate, but almost none will measure the rock that has to be drilled before it can be blasted. That asymmetry is why drilling schedules are systematically optimistic.
Drillability is captured by a family of indices — the uniaxial compressive strength for how hard the rock is to break, and a separate abrasiveness measure (usually tied to quartz content) for how hard the rock is on the bit. The two do not move together. A dense limestone can be strong but gentle on carbide, while a soft sandstone full of angular quartz grains can be weak yet destroy bits fast. A forecast that only looks at strength will be wrong in both directions on different benches.
My view is that a quarry should own a small, measured drillability profile of its own pit before it ever sizes a rig fleet or signs a schedule — because without it, every forecast is just someone's brochure number with extra steps.
Why You Forecast on the Worst Quartile, Not the Average
The most useful planning number in a quarry is not the average penetration rate across the whole pit. It is the rate in the worst quarter of the rock you will actually drill this season — the hard dyke, the abrasive zone, the water-bearing seam. The reason is arithmetic, not pessimism.
An average contains the good hours that pull it up, and a schedule cannot bank them. The crusher does not run faster because last month's bench drilled easily; it runs on the rock in front of it today. If the plan assumes the average and the bench delivers the worst quartile for two weeks, the schedule slips two weeks and no amount of good drilling later gives them back. Plan on the worst realistic metre, and the good ground becomes margin you can spend, not a promise you are relying on.
From Brochure to Real Metres: A Worked Example
Illustrative example only. The values are assumed to show the shape of the correction — substitute your own measured drillability, altitude, and bit-life numbers before using the result.
| Correction step |
Assumed condition |
Effect on rate |
Running forecast |
| Brochure rate |
120 MPa limestone, sea level, new bit |
— |
45.0 m/h |
| Rock drillability |
Abrasive quartzite, ~250 MPa |
−45% |
24.8 m/h |
| Air derating |
1,800 m altitude + hot aftercooler |
−12% |
21.8 m/h |
| Bit-life penalty |
60 m per bit, frequent changes |
−15% |
18.5 m/h |
| Depth and string |
Deep bench holes, long rows |
−10% |
16.7 m/h |
Read the chain as a whole. No single correction looks catastrophic, but compounded they turn 45 metres an hour into less than 17 — a sixty percent loss — before any utilisation or weather allowance is applied. That is the difference between a fleet of three rigs and a fleet of five, or between a schedule that holds and one that is broken by the second week.
The line doing the most damage is the first one, and it is the only line the quarry did not control or even measure. The air derating and the bit life are recoverable through maintenance and tooling; the rock is not. The same logic runs through every cost-per-metre calculation, which our cost-per-metre guide sets out in full.
The Cost of Getting the Rate Wrong, in Both Directions
Over-forecasting is the error everyone fears, but it is not the only one. A rate set too low has a cost of its own, and it is quieter.
If the forecast is too high, the fleet is too small, the schedule slips, and the costs are visible and loud — penalty clauses, an idle crusher waiting on blasted rock, and overtime drilling to claw the plan back. The drill-blast-load cycle article shows exactly where that idleness lands: on the feed belt, not on the rig.
If the forecast is too low, the opposite happens. The quarry over-buys rigs, parks capital in machines that stand idle for part of the shift, and every metre drilled carries the depreciation of a machine that was not needed. An over-staffed drilling operation also tends to drill ahead of the blast and load cycles, piling up charged holes that then wait on a window — inventory that cannot be stored and costs money the longer it sits. Neither direction is free; the forecast has a bullseye, not just a safe side.
Building a Forecast You Can Hold
A defensible penetration-rate forecast is not a bigger spreadsheet. It is four pieces of evidence that most sites already have the tools to gather.
- Measure your own drillability. Log compressive strength and quartz content by bench as you advance, and keep the two separate. Two or three seasons of this gives you a map of your own pit that no supplier's brochure can beat.
- Derate the air honestly. Apply altitude and temperature corrections to the compressor's rated output, and verify actual pressure at the hammer with a gauge rather than assuming it. Air is the biggest controllable lever on penetration, and the cheapest to lose.
- Track bit life in metres, not days. A bit that lasts a week tells you nothing until you know how many metres that week was. Metres per bit is the number that reveals when the rock has changed, and it feeds directly back into the rate forecast.
- Plan on the worst quartile. Build the schedule on the rate in the hardest quarter of rock you will drill, and treat the easy ground as margin. The schedule survives, and the good weeks become recovery rather than expectation.
Each of these is a measurement discipline, not a capital purchase. The forecast improves because the quarry starts looking at the rock it owns, instead of trusting a number printed for a rock it does not.
Why Welldone Mining
Welldone Mining supplies the drilling package, and we treat penetration rate as an engineering output rather than a sales claim. When we size a rig and compressor for a quarry, the rate forecast is built on the site's own drillability and air conditions, and the assumptions are written down so the site can challenge them.
What a quarry operator gets:
- A rate forecast tied to your rock, not our brochure. Send your compressive strength, quartz content, bench heights, and site altitude, and we return a corrected metres-per-shift estimate with each derating assumption stated, so you can verify it against your own drilling logs.
- Air delivery verified at the hammer. Because penetration in DTH drilling lives or dies on bailing air, the compressor is matched to the hole diameter and the altitude, and the air treatment is specified so the hammer receives what the forecast assumed.
- Tooling matched to the drillability. Button profile, bit size, and regrind interval are selected for the abrasiveness of your formation, so the bit-life penalty in the forecast is a managed number rather than a surprise.
Related Solutions
Conclusion
A brochure penetration rate is not wrong; it is just a description of a rock your quarry does not own. The moment the plan treats that number as a forecast, the schedule is borrowing from a bench that will not repay it.
Measure your own drillability, derate the air honestly, track bit life in metres, and plan on the worst quarter of rock in the pit. The forecast that results will be lower than the brochure and higher than your last bad week — and unlike either of those, it is a number you can hold a schedule to.
One question for your own bench: when you write down the metres-per-shift your next blast plan depends on, can you point to the drillability number it was built on — or is it still the brochure, wearing a safety factor and hoping?
Website: www.welldonemining.com
Email: info@welldonemining.com
Frequently Asked Questions
Why is my actual drilling rate so much lower than the brochure rate?
Because the brochure rate was measured in favourable conditions — softer rock, a new bit, full rated air at sea level, and a short hole. Your bench adds harder or more abrasive rock, an altitude-derated compressor, a partly worn bit, deeper holes, and an operator on a production clock. Each correction is small alone; compounded they commonly cut the brochure number by half or more. The worked example above shows the chain.
What is rock drillability and how do I measure it?
Drillability has two separate parts. Compressive strength (often expressed as uniaxial compressive strength in MPa) sets how hard the rock is to break, and abrasiveness (largely driven by quartz content) sets how fast the rock wears the bit. The two do not move together, so measure both. Log them by bench as you advance, and after a few seasons you have a map of your own pit that outperforms any supplier's number.
How much does altitude affect my drill's penetration rate?
Enough to matter. A compressor's rated output is at sea level, and both altitude and high ambient temperature reduce the actual air volume delivered to the hammer. In DTH drilling that air drives the piston and clears the cuttings, so a derated compressor means softer strikes and stalled cuttings — both of which cut penetration. Apply the manufacturer's altitude correction and verify actual pressure at the hammer with a gauge rather than assuming the nameplate value.
Should I plan my drilling schedule on the average penetration rate?
No. Plan on the rate in the hardest quarter of rock you will drill this season. An average contains the easy ground that pulls it up, but a schedule cannot bank easy hours — the crusher runs on the rock in front of it today. Planning on the worst realistic metre keeps the schedule whole, and the good ground becomes margin you can spend rather than a promise you are relying on.
Can Welldone Mining help me build a realistic rate forecast?
Yes. Send your compressive strength, quartz content, bench heights, hole depth, and site altitude to info@welldonemining.com. We return a corrected metres-per-shift estimate with each derating assumption written down, plus the compressor and tooling matched to that drillability, so you can verify the number against your own drilling logs and adjust it as your pit advances.